Logs
Reepolee writes logs to two places. Application output - anything from console.log, console.error, console.warn - goes to systemd's journal, which you read with journalctl. SQL queries (when SQL_LOGGING=true is set) go to a structured NDJSON file at logs/sql.ndjson. Everything else is wherever the rest of your stack puts it: Nginx access logs, system logs, your reverse proxy's whatever.
This page covers the two logs Reepolee produces, where to look for each, and the patterns for following live activity, searching history, and rotating files so they don't fill the disk.
The systemd Journal
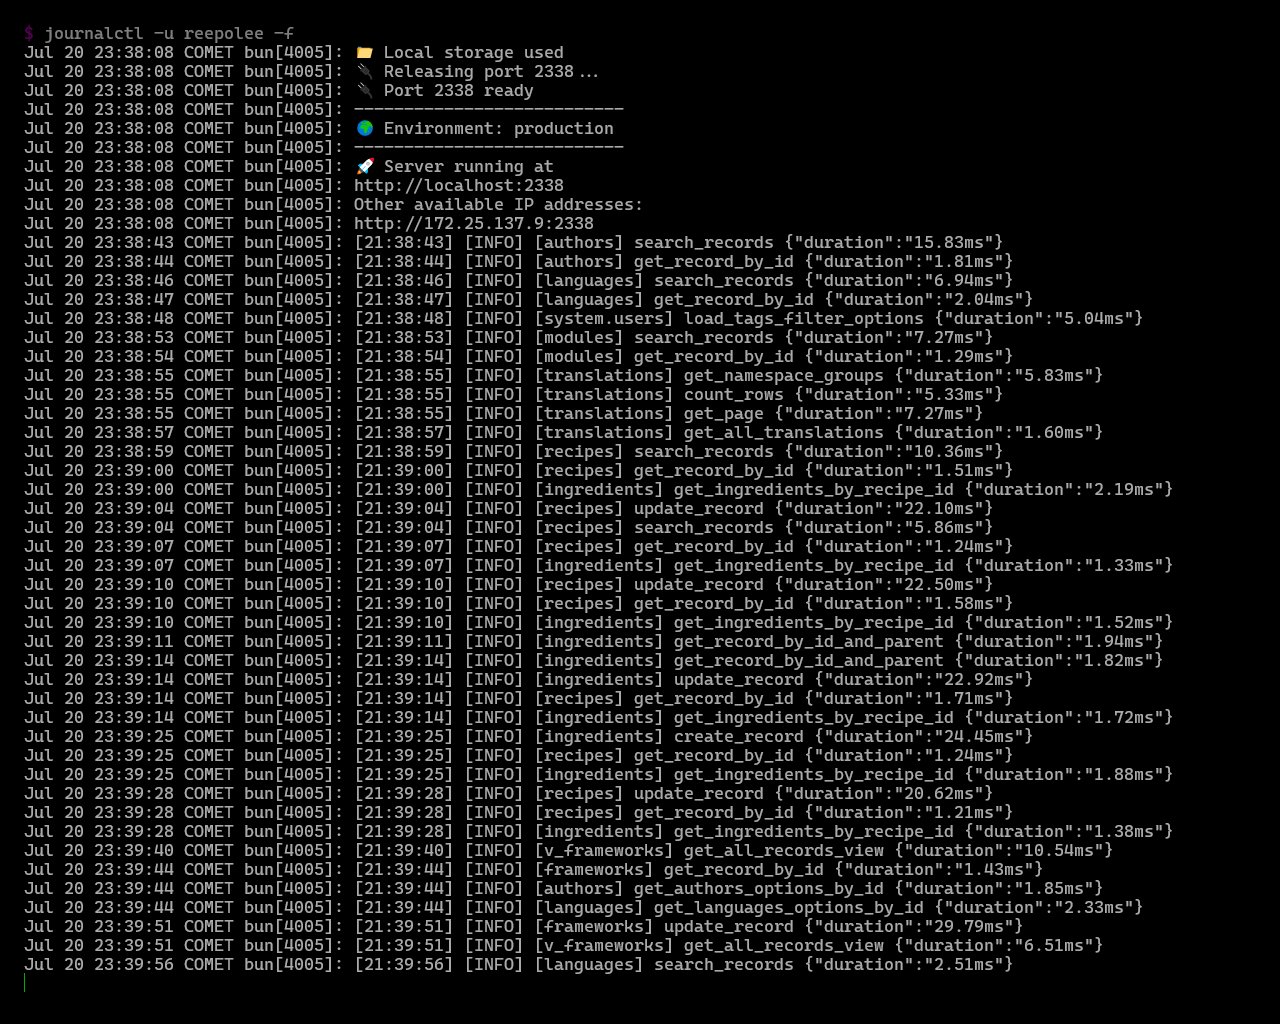
When the application runs as a systemd service (systemd), every line written to stdout and stderr is captured by the journal. Read it with journalctl:
sudo journalctl -u reepolee        # all entries, oldest first
sudo journalctl -u reepolee -n 100 # last 100 entries
sudo journalctl -u reepolee -f     # follow live (like tail -f)
The bun run service:logs script in package.json runs journalctl -u reepolee -f for the common case of "show me what the server is doing right now." It's the first command to reach for when investigating a live issue.
Filter by time:
sudo journalctl -u reepolee --since "1 hour ago"
sudo journalctl -u reepolee --since "2026-05-12 14:00"
sudo journalctl -u reepolee --since today --until "2 hours ago"
Filter by priority - --priority takes a syslog level. Useful when the journal is busy and you only want errors:
sudo journalctl -u reepolee -p err          # only error and above
sudo journalctl -u reepolee -p warning..err # warnings through errors
console.log writes at notice level, console.warn at warning, console.error at err. process.exit(1) and uncaught exceptions write at crit.
Reading Around an Incident
When you know roughly when something went wrong, the most useful pattern is to scope the journal to a tight time window:
sudo journalctl -u reepolee --since "10:30" --until "10:35"
Pipe through less for a long window (journalctl ... | less) or through grep for a specific signal (journalctl ... | grep "request_id=abc123"). Save the output to a file when you want to share it (> /tmp/incident.log).
For correlated debugging across services - application + Nginx + database - journalctl --since without -u shows everything in the journal across that window:
sudo journalctl --since "10:30" --until "10:35"
Useful when the bug crosses service boundaries.
SQL Logging
Reepolee's SQL log captures every query the application runs, with parameters and execution time. It's gated by the SQL_LOGGING environment variable so you can turn it on per environment without code changes:
# .env
SQL_LOGGING=true
When enabled, each query writes one NDJSON line to logs/sql.ndjson. NDJSON is "newline-delimited JSON" - one JSON object per line, easy to parse with jq or any streaming JSON tool.
A typical entry:
{
    "ts": "2026-05-12T14:23:01.234Z",
    "query": "SELECT * FROM users WHERE id = ? LIMIT 1",
    "params": [42],
    "duration_ms": 1.4
}
Read it with tail -f for live activity, jq for filtering:
tail -f logs/sql.ndjson

# slow queries
tail -f logs/sql.ndjson | jq 'select(.duration_ms > 50)'

# all queries hitting a specific table
jq 'select(.query | contains("FROM users"))' logs/sql.ndjson | head -20

# count queries by query string
jq -r '.query' logs/sql.ndjson | sort | uniq -c | sort -rn | head
The "count by query string" pattern is good for spotting N+1 patterns - if one query shows up 200 times in a 30-second window, it probably belongs in a JOIN or a single batched fetch.
When to Enable It
In production, SQL logging adds I/O for every query. For most projects it's still cheap enough to leave on permanently - the writes are async, the disk usage is a few hundred bytes per query - and the visibility is worth it. For very high-traffic applications, turn it on selectively while investigating a specific issue, then back off.
In development, leave it on always. You'll catch slow queries before they hit production, and the file is small enough that you can cat logs/sql.ndjson for a complete picture of what the last few requests did.
The log doesn't include db.unsafe() calls - those bypass the tagged-template instrumentation. If you want to log them too, wrap your call sites or add the logger to unsafe()'s call path manually.
Rotating the SQL Log
logs/sql.ndjson grows until you stop it. For production, set up logrotate to handle it the same way it handles system logs. Create /etc/logrotate.d/reepolee:
/home/deploy/app/logs/sql.ndjson {
    daily
    rotate 14
    compress
    missingok
    notifempty
    copytruncate
}
copytruncate is the important option: it copies the file's contents to the rotated archive, then truncates the original in place. That's necessary because the application keeps a file handle open - moving the file (the default rotate behaviour) would leave the application writing to the moved file under a hidden name, and you'd see no log entries in the active file.
Test the rotation:
sudo logrotate -d /etc/logrotate.d/reepolee   # dry run
sudo logrotate -f /etc/logrotate.d/reepolee   # force a rotation now
After rotation you'll see sql.ndjson.1, sql.ndjson.2.gz, etc. up to 14 days back.
Logging From Your Code
For application-level structured logging - request IDs, user IDs, business events - console.log writes to the journal but doesn't structure the output. For better signal, write JSON yourself and parse it in the journal with jq:
function log(level: string, message: string, context: Record<string, unknown> = {}) {
    const line = JSON.stringify({
        ts: new Date().toISOString(),
        level,
        message,
        ...context,
    });
    if (level === "error") console.error(line);
    else console.log(line);
}

log("info", "user_signed_in", { user_id: user.id, email: user.email });
log("error", "send_mail_failed", { to, error: error.message });
Then in the journal:
sudo journalctl -u reepolee --since "1 hour ago" -o cat | jq 'select(.level == "error")'
-o cat strips the systemd metadata so the line is pure JSON, ready for jq. For richer needs (correlation IDs across requests, structured query logging), the same shape extends - add fields, never lose them by overwriting.
If you run under PM2 instead of systemd, the application output goes to ~/.pm2/logs/reepolee-out.log and ~/.pm2/logs/reepolee-error.log, read with pm2 logs. The SQL log is the same either way.
For a small library, pino does this well and works under Bun. Reepolee doesn't ship one because the seven-line log() function above covers what most projects need without adding a dependency.
Nginx Access Logs
If you've put Nginx in front of the application (Reverse Proxy), the request log lives there:
sudo tail -f /var/log/nginx/access.log
sudo tail -f /var/log/nginx/error.log
The access log records every request that hit the proxy with status, response size, and latency. The error log records configuration problems, upstream connection failures, and any HTTP-protocol-level errors.
For a per-request correlation between Nginx and the application, propagate a request ID:
location / {
    proxy_set_header X-Request-ID $request_id;
    # ... other proxy headers
}
Then in the application, read req.headers.get("X-Request-ID") and include it in your log lines. The same ID appears in both the Nginx access log (in a custom log_format) and your application log, so you can trace a request across the two.
Watching Disk Usage
Two places to check periodically - journalctl --disk-usage for the systemd journal and du -sh logs/ for the SQL log:
sudo journalctl --disk-usage              # how much space the journal uses
sudo journalctl --vacuum-size=1G          # cap the journal at 1 GB
sudo journalctl --vacuum-time=14d         # keep only 14 days
The journal's defaults usually keep it under control, but a chatty application or a deploy that crash-loops can fill it fast. Cap the size with --vacuum-size to prevent a runaway log from filling the partition.
For the SQL log, du -sh logs/ shows the current footprint. If it grows fast, double-check that logrotate is in place (logrotate -d /etc/logrotate.d/reepolee) and that the application is actually picking up rotated files (copytruncate in the config above).